Page 3 of 4
Re: Plotting locations on Google Maps

Posted:
Fri Mar 17, 2017 2:16 pmby vilian
In your previous sample, You are using the address to put the markers.
- Code: Select all Expand view
AAdd( aDatas, VerMapa2( "28850", "Calle Manuel Sandoval", "1", "Torrejon de Ardoz", "Madrid", "Spain" ) )
I need to do this using Latitude e longitude. I have this code that is working:
- Code: Select all Expand view
STATIC FUNCTION ShowGoogleMap(aData)
LOCAL cHtmlContent1,cHtmlContent2, oOle, i,cMapFile
LOCAL cAppendStr:="var locations = ["+CRLF

   cMapFile:= RetArqTmp("htm")+".htm"
   FOR i:=1 to Len(aData)
       cAppendStr+=Space(4)+"['" +aData[i][1] +"',"+Ltrim(Str(aData[i][2]))+","+ Ltrim(Str(aData[i][3]))+ If( i < Len(aData), "],", "]") +CRLF
   NEXT
   cAppendStr+="];"+CRLF


   TEXT INTO cHtmlContent1

       <html>
       <head>

         <title>Google Maps Multiple Markers</title>
         <script src="http://maps.google.com/maps/api/js?sensor=false" type="text/javascript"></script>
       </head>
       <body>
         <div id="map" style="height: 100%; width: 100%;">
       </div>
       <script type="text/javascript">

   ENDTEXT


   TEXT INTO cHtmlContent2

        var map = new google.maps.Map(document.getElementById('map'), {
        zoom: 0,
         mapTypeId: google.maps.MapTypeId.ROADMAP
         });
        var bounds = new google.maps.LatLngBounds();
        var infowindow = new google.maps.InfoWindow();

        var marker, i;

       for (i = 0; i < locations.length; i++) {
            var position = new google.maps.LatLng(locations[i][1], locations[i][2]);
               bounds.extend(position);
               marker = new google.maps.Marker({
               position: new google.maps.LatLng(locations[i][1], locations[i][2]),
               title: locations[i][0],
               map: map
         });

         google.maps.event.addListener(marker, 'click', (function(marker, i) {
         return function() {
         infowindow.setContent(locations[i][0]);
         infowindow.open(map, marker);
         }
         })(marker, i));

         // Automatically center the map fitting all markers on the screen
         map.fitBounds(bounds);

       }
     </script>
     </body>
     </html>

   ENDTEXT
However, I only can see the titles of the markers if I click over them.
Re: Plotting locations on Google Maps
Posted:
Fri Mar 17, 2017 2:44 pmby cnavarro
Please look function in my sample
viewtopic.php?f=3&t=33729&start=15#p199586and uncomment line
// XBrowse(
My function VerMapa2, return lat and long and other data
Use only position 2 and 3 of array aData
Re: Plotting locations on Google Maps
Posted:
Fri Mar 17, 2017 2:53 pmby cnavarro
I think I have not understood him well yet
If you have lat and long, Pass the array with that data to the function
ViewLeafLet( aDatas )
Re: Plotting locations on Google Maps
Posted:
Fri Mar 17, 2017 6:19 pmby vilian
Cnavarro,
Thank you it's working now

Why the map is not growing when we maximize the window? Is it possible?
Re: Plotting locations on Google Maps
Posted:
Fri Mar 17, 2017 7:47 pmby cnavarro
Try with TActiveX, have a data ::oWnd
Re: Plotting locations on Google Maps
Posted:
Fri Mar 17, 2017 8:31 pmby vilian
I tried this:
- Code: Select all Expand view
  DEFINE WINDOW oWndEdt

      oAct:=TActiveX():New(oWndEdt,"Shell.Explorer.2")
       oWndEdt:oClient = oAct

   ACTIVATE WINDOW oWndEdt MAXIMIZED;  ;
       VALID (lCancela:=.t.)

       oAct:Navigate(cMapFile)
However, when I changed to this, only the first mark is shown, and I have severals marks.
Re: Plotting locations on Google Maps
Posted:
Fri Mar 17, 2017 8:44 pmby cnavarro
Try in clausule ON INIT of oWndEdt -> oAct:Navigate(cMapFile)
Also try in clausule ON PAINT
Re: Plotting locations on Google Maps
Posted:
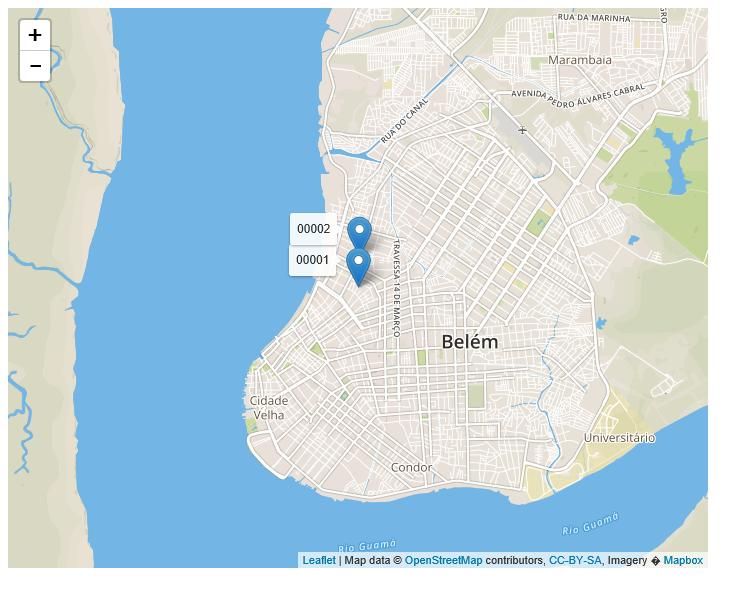
Fri Mar 17, 2017 9:09 pmby vilian
With ActiveX I have this screen:
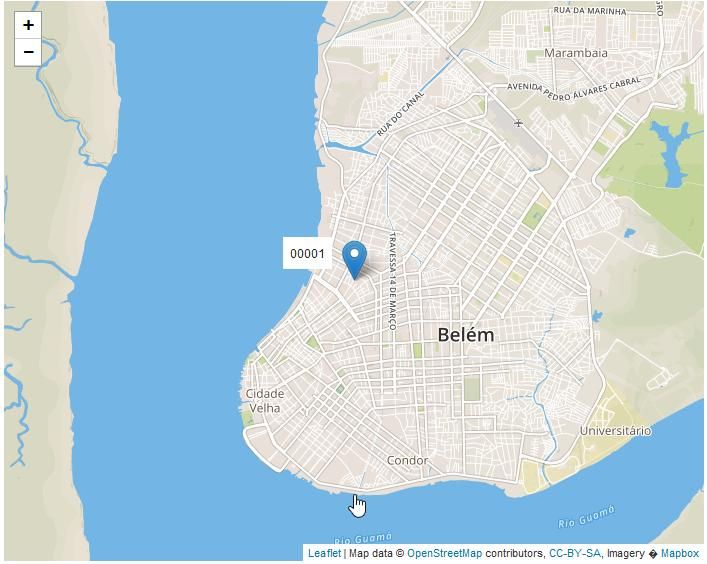
With exactly the same code, but changing for show with createobject, I have this screen:
Re: Plotting locations on Google Maps
Posted:
Fri Mar 17, 2017 9:20 pmby cnavarro
Try
- Code: Select all Expand view
   MEMOWRIT( cMapFile, cHtmlContent1 + cInitMap + cHtmlContent2 + cAppendStr + cHtmlContent3 )
   CreaWin( cMapFile )

   /*
   oOle := CreateObject( "InternetExplorer.Application" )
   //oOle:bOnEvent  := { | n1, n2, n3 | LeafLetEvent( n1, n2, n3 ) }
   oOle:Width     := 750
   oOle:Height    := 650
   oOle:Visible   := .T.     // Displays the Browser
   oOle:ToolBar   := .F.     // Disables the toolbar
   oOle:StatusBar := .F.     // Disables status bar
   oOle:MenuBar   := .F.     // Disables the menu bar
   oOle:Navigate( cMapFile ) // Open the Webpage
   SysRefresh()
   */
Return nil

//----------------------------------------------------------------------------//

Function CreaWin( cMapFile )

   local oWnd
   local oAct
   local lCancela := .F.
   DEFINE WINDOW oWnd

   ACTIVATE WINDOW oWnd MAXIMIZED  ;
       VALID ( lCancela:=.t., .T. ) ;
       ON INIT ( ;
          oAct    := TActiveX():New( oWnd, "Shell.Explorer.2"), ;
          oWnd:oClient := oAct, ;
          oAct:Navigate( cMapFile ), SysRefresh() )

Return nil

//----------------------------------------------------------------------------//
But you have to modify the function
<body>
<div id="mapid" style="width: 700px; height: 560px;"></div>
<script>
Re: Plotting locations on Google Maps
Posted:
Sat Mar 18, 2017 3:50 amby anserkk
Instead of
cnavarro wrote:
<body>
<div id="mapid" style="width: 700px; height: 560px;"></div>
<script>
It would be better to use
<div id="map" style="height: 100%; width: 100%;">
Re: Plotting locations on Google Maps
Posted:
Mon Mar 20, 2017 11:45 amby vilian
anserkk wrote:Instead of
cnavarro wrote:
<body>
<div id="mapid" style="width: 700px; height: 560px;"></div>
<script>
It would be better to use
<div id="map" style="height: 100%; width: 100%;">
When I change to this, the map is not shown

Re: Plotting locations on Google Maps
Posted:
Mon Mar 20, 2017 11:48 amby vilian
cnavarro wrote:Try
- Code: Select all Expand view
   MEMOWRIT( cMapFile, cHtmlContent1 + cInitMap + cHtmlContent2 + cAppendStr + cHtmlContent3 )
   CreaWin( cMapFile )

   /*
   oOle := CreateObject( "InternetExplorer.Application" )
   //oOle:bOnEvent  := { | n1, n2, n3 | LeafLetEvent( n1, n2, n3 ) }
   oOle:Width     := 750
   oOle:Height    := 650
   oOle:Visible   := .T.     // Displays the Browser
   oOle:ToolBar   := .F.     // Disables the toolbar
   oOle:StatusBar := .F.     // Disables status bar
   oOle:MenuBar   := .F.     // Disables the menu bar
   oOle:Navigate( cMapFile ) // Open the Webpage
   SysRefresh()
   */
Return nil

//----------------------------------------------------------------------------//

Function CreaWin( cMapFile )

   local oWnd
   local oAct
   local lCancela := .F.
   DEFINE WINDOW oWnd

   ACTIVATE WINDOW oWnd MAXIMIZED  ;
       VALID ( lCancela:=.t., .T. ) ;
       ON INIT ( ;
          oAct    := TActiveX():New( oWnd, "Shell.Explorer.2"), ;
          oWnd:oClient := oAct, ;
          oAct:Navigate( cMapFile ), SysRefresh() )

Return nil

//----------------------------------------------------------------------------//
But you have to modify the function
<body>
<div id="mapid" style="width: 700px; height: 560px;"></div>
<script>
IF I'm using with ActiveX, only one mark is shown and I'm inserting two.
Re: Plotting locations on Google Maps
Posted:
Wed Mar 22, 2017 12:05 amby TimStone
Using your leaflet sample, what command line is adding the shading of the space between the markers ? I only want to display the markers, and not connect them.
In my case, the connecting lines are all over the place, so it looks like a star, rather than just outlining the perimeter of the markers.
Tim
Re: Plotting locations on Google Maps
Posted:
Wed Mar 22, 2017 11:43 amby vilian
Timstone,
To remove the polygon, change this:
- Code: Select all Expand view
cAppendStr += "]).addTo(mymap).bindPopup('I am a polygon.');" + CRLF + CRLF
For this:
- Code: Select all Expand view
cAppendStr += "]);" + CRLF + CRLF
Re: Plotting locations on Google Maps
Posted:
Tue Nov 13, 2018 11:22 pmby vilian
Hi guys,
I have been used the code include in this topic for several months, but since yesterday don't work anymore.
I think they made any change on Google Maps. Do you know what was changed ?