FiveTech Software tech support forums
www.FiveTechSoft.com
Search found 83 matches: axis
Re: cyclometric circle
... right and in their place and also the numbers only in the lower part touch the edge of the object the numbers seem crooked to me i.e. there is no axis 90-> 45 the numbers are slightly off , How I can resolve ? New code #include "fivewin.ch"#include "constant.ch"Function ...
- Fri Dec 02, 2022 12:10 pm
- Forum: FiveWin for Harbour/xHarbour
- Topic: cyclometric circle
- Replies: 46
- Views: 3367
Re: TGraph 2 Y-axis for different's scales
This is what I had done so far adjusting tgraph class: 1.- 2nd Y-axis, 2.- Tooltips on lines graph. 3.- You can place legend on top, bottom, right or left position. 4.- Differents Picture mask for X-axis, Y-axis and 2nd Y-axis Still working on setting scales ...
- Tue Dec 03, 2019 10:09 am
- Forum: FiveWin for Harbour/xHarbour
- Topic: TGraph 2 Y-axis for different's scales
- Replies: 20
- Views: 3652
Re: TGraph 2 Y-axis for different's scales
hebert_j_vargas
Saludos, soy Juan Navas, estoy interesado en contactarte 0414-3000518 adaptaprodrive@gmail.com
Saludos, soy Juan Navas, estoy interesado en contactarte 0414-3000518 adaptaprodrive@gmail.com
- Tue Dec 03, 2019 9:51 am
- Forum: FiveWin for Harbour/xHarbour
- Topic: TGraph 2 Y-axis for different's scales
- Replies: 20
- Views: 3652
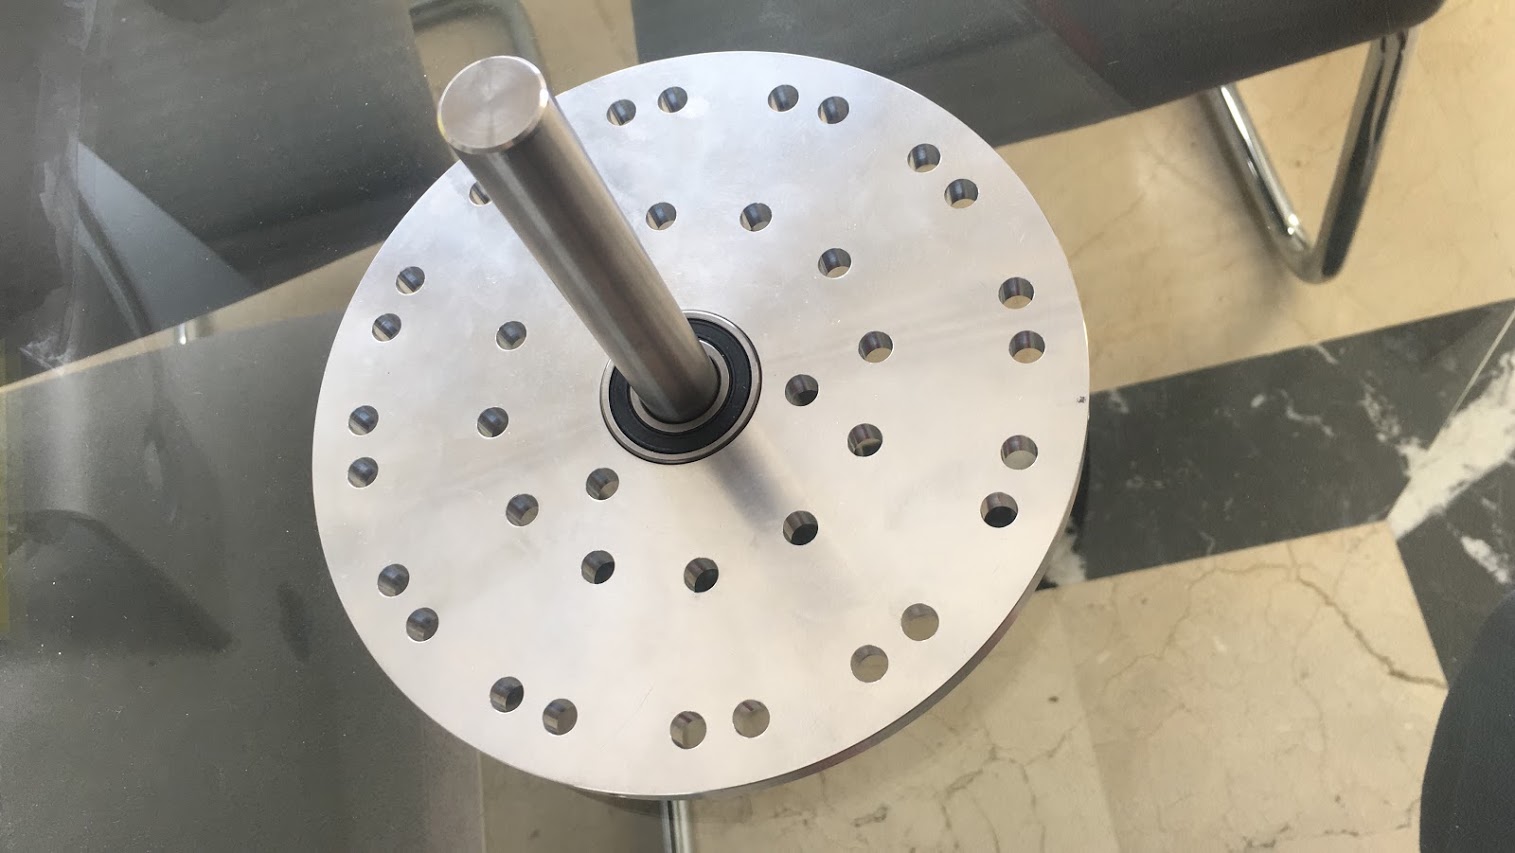
Re: FiveTech's Electric engine project
The axis properly fits 
El eje ajustado correctamente
El eje ajustado correctamente
- Fri Mar 22, 2019 12:32 pm
- Forum: Off Topic / Otros temas
- Topic: FiveTech's Electric engine project
- Replies: 13
- Views: 3633
New FTDN March/Marzo 2018 (FWH 18.03)
... nXMinVal // Min Value XY_nPenwidth // Penwith for the XY data XY_nPixels // size of the points painted cXpicture // picture of values in the X axis nXXRanges // number of ranges in the X axis Please review new samples\testgrph.prg. Many thanks to Alvaro Quintana for his great help. * FWMariaRowSet: ...
- Tue Apr 24, 2018 9:25 am
- Forum: WhatsNew / Novedades
- Topic: New FTDN March/Marzo 2018 (FWH 18.03)
- Replies: 0
- Views: 1708
Re: Can TGraph do X,Y plots?
... The line chart that TGraph has already, is a series chart where the X-axis data is in increasing order starting from the smallest point. An example might be temperature vs month-of-the-year. Here is a sample line chart: ...
- Wed Mar 07, 2018 8:04 am
- Forum: FiveWin for Harbour/xHarbour
- Topic: Can TGraph do X,Y plots?
- Replies: 18
- Views: 5584
Re: Can TGraph do X,Y plots?
... The line chart that TGraph has already, is a series chart where the X-axis data is in increasing order starting from the smallest point. An example might be temperature vs month-of-the-year. Here is a sample line chart: ...
- Wed Mar 07, 2018 1:05 am
- Forum: FiveWin for Harbour/xHarbour
- Topic: Can TGraph do X,Y plots?
- Replies: 18
- Views: 5584
Re: Can TGraph do X,Y plots?
Alvaro, It is not clear to me if you are automatically finding the min and max for each axis in the class, or if you must do the calculation outside the class and pass those values. One of the first programs I wrote (way back in the BASIC era, circa 1980), I wrote ...
- Tue Mar 06, 2018 6:48 pm
- Forum: FiveWin for Harbour/xHarbour
- Topic: Can TGraph do X,Y plots?
- Replies: 18
- Views: 5584
Re: Can TGraph do X,Y plots?
Alvaro, It is not clear to me if you are automatically finding the min and max for each axis in the class, or if you must do the calculation outside the class and pass those values. One of the first programs I wrote (way back in the BASIC era, circa 1980), I wrote code ...
- Tue Mar 06, 2018 5:26 pm
- Forum: FiveWin for Harbour/xHarbour
- Topic: Can TGraph do X,Y plots?
- Replies: 18
- Views: 5584
Re: TGraph 2 Y-axis for different's scales
This is what I had done so far adjusting tgraph class: 1.- 2nd Y-axis, 2.- Tooltips on lines graph. 3.- You can place legend on top, bottom, right or left position. 4.- Differents Picture mask for X-axis, Y-axis and 2nd Y-axis Still working on setting scales ...
- Sat Aug 19, 2017 3:05 am
- Forum: FiveWin for Harbour/xHarbour
- Topic: TGraph 2 Y-axis for different's scales
- Replies: 20
- Views: 3652
Re: TGraph 2 Y-axis for different's scales
Thanks Mr Silivio. I am thinking.
- Fri Aug 11, 2017 6:46 am
- Forum: FiveWin for Harbour/xHarbour
- Topic: TGraph 2 Y-axis for different's scales
- Replies: 20
- Views: 3652
Re: TGraph 2 Y-axis for different's scales
nageswaragunupudi wrote:I appreciate your ingenuity in finding a nice workaround.
Now TGraph does not support 2 Y-Axis and we all agree that this is a required feature.
We shall provide this very soon.
Mr Rao,
do you remember the type of graph you make me this year ?
Why not insert also these features on tgraph class ?
- Thu Aug 10, 2017 5:14 pm
- Forum: FiveWin for Harbour/xHarbour
- Topic: TGraph 2 Y-axis for different's scales
- Replies: 20
- Views: 3652
Re: TGraph 2 Y-axis for different's scales
Thank you Mr James
As always your inputs are very valuable.
As always your inputs are very valuable.
- Wed Aug 09, 2017 5:24 pm
- Forum: FiveWin for Harbour/xHarbour
- Topic: TGraph 2 Y-axis for different's scales
- Replies: 20
- Views: 3652
Re: TGraph 2 Y-axis for different's scales
... it's shortcomings. Most of the variable names are very cryptic and many are misleading which causes constant confusion. For instance, the X and Y axis variables are swapped. The X variables are really for the Y-axis and visa versa. Very confusing. For instance, these are for the Y-axis and either ...
- Wed Aug 09, 2017 3:52 pm
- Forum: FiveWin for Harbour/xHarbour
- Topic: TGraph 2 Y-axis for different's scales
- Replies: 20
- Views: 3652
Re: TGraph 2 Y-axis for different's scales
I appreciate your ingenuity in finding a nice workaround.
Now TGraph does not support 2 Y-Axis and we all agree that this is a required feature.
We shall provide this very soon.
Now TGraph does not support 2 Y-Axis and we all agree that this is a required feature.
We shall provide this very soon.
- Wed Aug 09, 2017 1:28 pm
- Forum: FiveWin for Harbour/xHarbour
- Topic: TGraph 2 Y-axis for different's scales
- Replies: 20
- Views: 3652